IVF Success Rates
ACRM/CCRM Atlanta
With the guidance and care of our doctors, building the family that you have always dreamed of can become a reality.
Pregnancy Rates Per Embryo Transfer
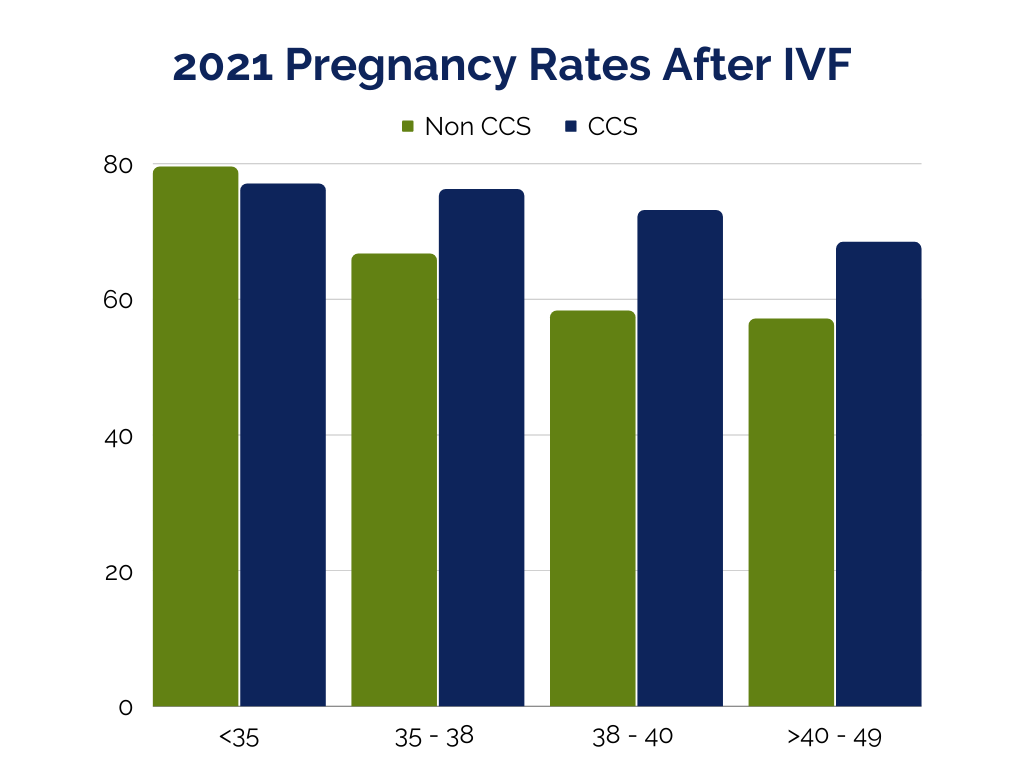
- The graph below, sorted by female age, represents the chance of conceiving each time an embryo is transferred to the patient's uterus.
-
This data is from the 2021 calendar year, so birth rates are not yet recorded.
- We expect lower miscarriage rates (5-10%) and higher live birth rates after transferring a chromosomally normal embryo from IVF with Comprehensive Chromosome Screening (CCS/PGT-a) – the blue bars in the graph below.
- Miscarriage rates may be up to 20% after IVF without Comprehensive Chromosome Screening (CCS/PGT-a) – the green bars in the graph below.
- Your doctor will be able to review these results and how they apply to you during your consultation.

Why do these rates appear different than what you see on the CDC SART Website?
- The denominator in the above graph is the total number of women who received an embryo transfer in that age group.
-
The CDC data uses different, larger denominators for their statistics:
- Live Birth per Intended Egg Retrieval – the denominator is every woman who had an egg retrieval in that age group – remember, not every woman who has a retrieval will have an embryo for transfer. This is especially true for older women, women with diminished ovarian reserve (DOR), men with severe sperm problems and couples with genetic conditions. So, the denominator is much larger than in the above graph.
- Live Birth per New Patient visit – the denominator is very large and includes every woman who had a new patient visit in that age group – remember, not every woman who has a New Patient visit can/will pursue treatment.
- ACRM's Preliminary 2020 SART Data